
However, the RPKM calculation assumes that the total RNA content is the same across all samples. As a result, the RPKM value for a specific transcript reflects its relative abundance within that sample, not its quantity. When comparing transcript expression across samples, differences in the overall RNA composition can distort these comparisons and may lead to misleading interpretations. For example, even if the true expression level of transcript Y remains constant, its RPKM value can appear higher or lower due to changes in the expression of other transcripts in the sample [1].
Low abundance transcripts are not reliably quantified by RNA-Seq
RNA-Seq can struggle with accurately quantifying low abundance transcripts due to its reliance on sequencing depth and the inherent variability in read counts. This variability can lead to challenges in detecting low abundance RNAs, as the stochastic nature of sequencing can result in insufficient reads for accurate quantification. For low-abundance RNAs, Poisson sampling noise due to finite read depth is the dominant source of error in RNA-Seq [2]. Consequently, poorly expressed transcripts cannot be measured by RNA-Seq reliably and need enrichment [2].
The relationship between gene expression level and measurement precision was studied and characterized in datasets using three technical replicates containing 331 million 50bp reads each [3]. As seen in Figure 1, the higher the gene expression level, the more precise the measurement. Conversely, the lower the gene expression level, the higher the relative error in the measurement.
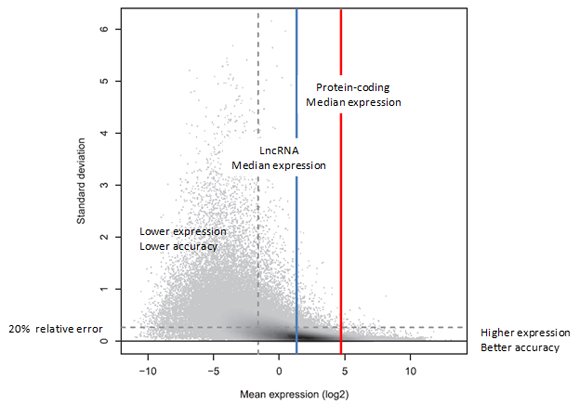
Figure 1. Standard deviation versus expression level. The plot shows the variation across three technical replicate measurements (standard deviation, y-axis), with each discernible dot representing a transcript target. In the shaded areas, the grey level represents density, with dark shading indicating higher densities. The standard deviation is in general larger for transcripts with lower mean expression levels (x-axis). More strongly expressed transcripts could often be measured reliably, with a relative error of 20% or less. Interestingly, just 41% of all transcript targets could be measured with such precision (below the horizontal dashed line). Of the 41% most strongly expressed transcripts (to the right of the vertical dashed line), on the other hand, 84% could be measured reliably (below the horizontal dashed line). This is reflected by the high density of targets on the right (dark shading) falling largely below the horizontal line, which is not the case to the left of the vertical dashed line. (Reproduced from [3]).
Increased read depths have limited gains in accuracy for low abundance transcripts
In order to measure the expression levels more accurately, one could increase the RNA-seq read depths. Generally, 100 million reads are sufficient to detect most expressed genes and transcripts, but 500 million reads are needed to quantify the majority (i.e. 72%) of the gene expression levels accurately [4]. However, increased read depths only have a significant impact on the accuracy of abundantly-expressed transcripts, whereas the accuracy of poorly-expressed transcripts is relatively unchanged with increasing read depths, as seen in the case studies of PHB, CD74, and BRD4 transcript isoforms at different abundance levels [4].
Microarrays are more adept for low abundance RNA profiling
In microarray profiling, RNAs are interrogated by hybridization with sequence-specific probes. For a particular transcript, the presence of unrelated sequences even in high abundance behaves no differently than carrier RNA in the hybridization solution, with little to no effect on detection of poorly-expressed transcripts. In RNA-Seq, however, the lion’s share of sequencing reads is occupied by high abundance RNAs such as housekeeping genes, leaving the low abundance RNAs poorly covered by low read depths. The low reads account for low sensitivity and reliability. Therefore, microarrays have better performance characteristics for low abundance RNAs. For example, 7000~12,000 LncRNAs are routinely detectable by microarrays vs. 1000~4000 lncRNAs by RNA-seq requiring more than 120 million reads [5]. In a clinical study, microarrays were chosen over RNA-seq because, among other considerations, the better sensitivity [6].
Reference
1. Zhao S et al:. (2020) Misuse of RPKM or TPM normalization when comparing across samples and sequencing protocols. RNA 2020, 26(8):903-909
2. Jiang L et al: Synthetic spike-in standards for RNA-seq experiments. Genome Res 2011, 21(9):1543-1551.[PMID: 21816910]
3. Labaj PP et al: Characterization and improvement of RNA-Seq precision in quantitative transcript expression profiling. Bioinformatics 2011, 27(13):i383-391.[PMID: 21685096]
4. Toung JM, Morley M, Li M, Cheung VG: RNA-sequence analysis of human B-cells. Genome Res 2011, 21(6):991-998.[PMID: 21536721]
5. Kretz M et al: Suppression of progenitor differentiation requires the long noncoding RNA ANCR. Genes Dev 2012, 26(4):338-343.[PMID: 22302877]
6. Xu W et al: Human transcriptome array for high-throughput clinical studies. Proc Natl Acad Sci U S A 2011, 108(9):3707-3712.[PMID: 21317363]